
1. Chart Title
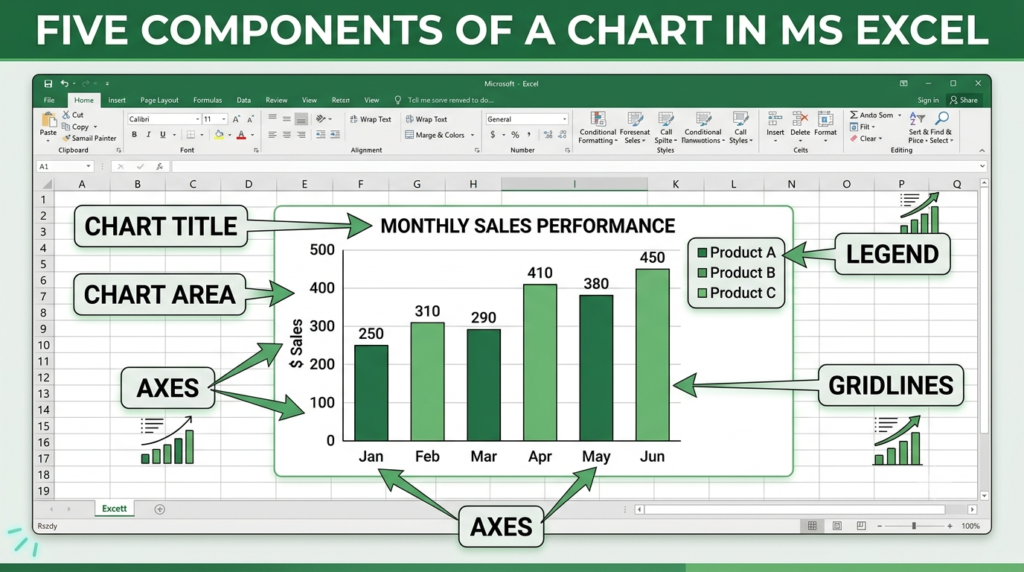
The chart title describes the subject or purpose of the chart. It helps readers understand what information the chart represents.
Example: Monthly Sales Report.
2. Chart Area
The chart area is the entire chart object, including the plot area, titles, axes, legend, and other chart elements. It contains all the visual components of the chart.
3. Axes
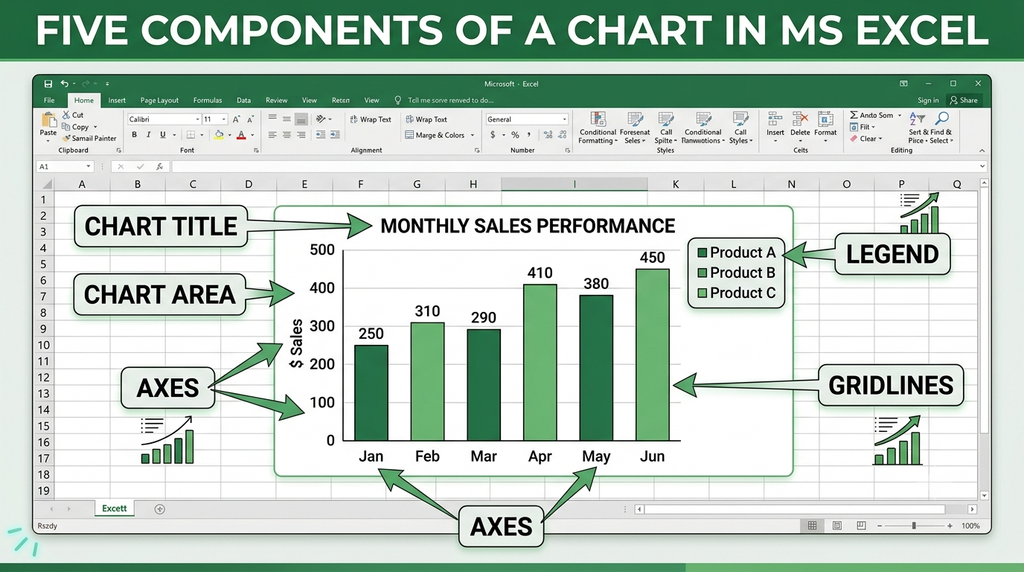
Axes are reference lines used to display categories and values in charts such as bar, column, and line charts. The horizontal axis usually displays categories, while the vertical axis usually displays numerical values.
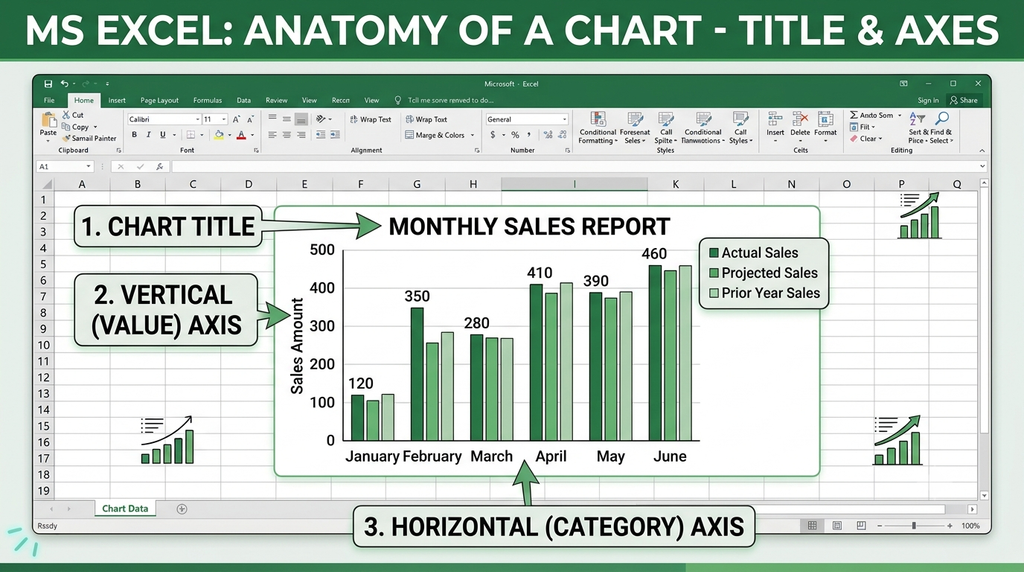
Example: A chart comparing monthly sales may show the months on the horizontal axis and sales amounts on the vertical axis.
4. Legend
A legend identifies the colors, patterns, or symbols used for different data series in a chart. It helps readers distinguish between multiple sets of data.
Example: In a sales chart, the legend may identify separate colors for sales in 2025 and 2026.
5. Gridlines
Gridlines are horizontal or vertical lines displayed across the plot area. They help readers estimate and compare data values against the chart’s axes.

Example: Horizontal gridlines help readers estimate the sales amount represented by each column in a column chart.
Conclusion
The chart title, chart area, axes, legend, and gridlines are five important components of a chart. Together, they help present data clearly and make charts easier to read and interpret.