Introduction
A chart is a graphical representation of data that helps users understand information, compare values, and identify trends. In older versions of Microsoft Excel, the Chart Wizard provided a step-by-step method for creating charts through a series of dialog boxes.
The Chart Wizard guided users through selecting a chart type, specifying the data range, setting chart options, and choosing where the chart should appear. In modern versions of Excel, these tasks are performed using the Insert tab and chart-related options.
Steps to Create a Chart Using the Chart Wizard
The Chart Wizard in older versions of Excel consists of four main steps.
Step 1: Select the Chart Type
- Enter the data into the worksheet and select the required data range, including headings.
- Click the Insert menu and select Chart to open the Chart Wizard.
- Choose a suitable chart type, such as Column, Bar, Line, or Pie.
- Select the required chart subtype and click Next.

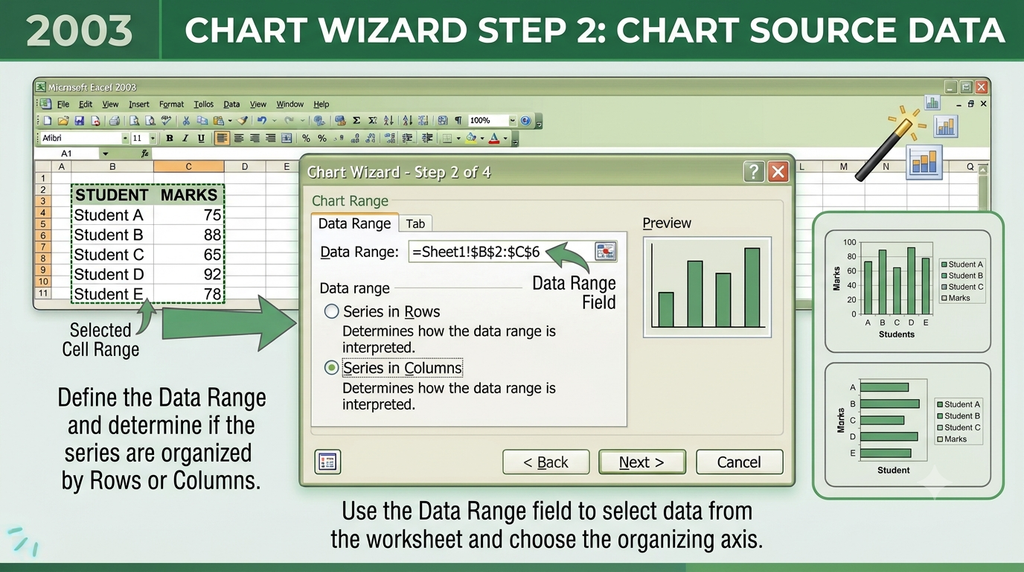
Step 2: Select the Chart Source Data
- Specify or verify the cell range containing the data to be displayed.
- Check whether the data series should be arranged in rows or columns.
- Review the chart preview to ensure the correct data is included.
- Click Next to continue.
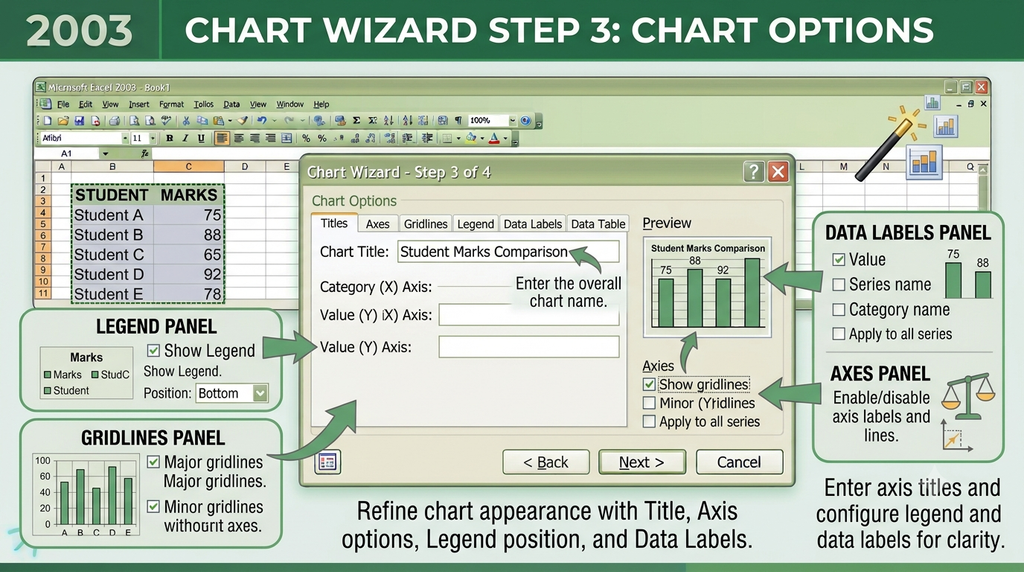
Step 3: Set the Chart Options
- Enter an appropriate chart title.
- Add horizontal and vertical axis titles if required.
- Configure the legend to identify different data series.
- Choose gridlines and data labels where appropriate.
- Review the chart’s appearance and click Next.
Step 4: Choose the Chart Location
- Select whether to place the chart as a new chart sheet or as an object within an existing worksheet.
- Choose the appropriate location.
- Click Finish to create the chart.

The chart will appear in the selected location. You can then resize it or adjust its formatting as required.
Example
Suppose a worksheet contains students’ names and their marks in different subjects. To compare their marks, select the data, choose a Column Chart, verify the data range, add the title Student Marks Comparison, configure the legend and axes, and finish the wizard. Excel creates a chart that makes the marks easier to compare.

Note About Modern Excel
The classic Chart Wizard was removed beginning with Excel 2007. In current desktop versions, select the data, go to Insert → Recommended Charts or choose a chart type from the Charts group, and customize the chart using the chart-design tools.
Conclusion
The Chart Wizard simplifies chart creation through four steps: Chart Type, Chart Source Data, Chart Options, and Chart Location. Following these steps helps users create clear charts that present worksheet data effectively.