Introduction
Charts and graphics are important tools for presenting information in a clear, attractive, and understandable way. In applications such as Microsoft Excel, charts convert numerical data into visual representations, while graphics help explain ideas and highlight important information. They make complex information easier to understand and help readers identify patterns, comparisons, and trends quickly.
Importance of Charts and Graphics
1. Simplify Complex Information
Charts present large amounts of numerical data in a visual form, making information easier to understand than lengthy tables or paragraphs.
2. Make Comparisons Easier
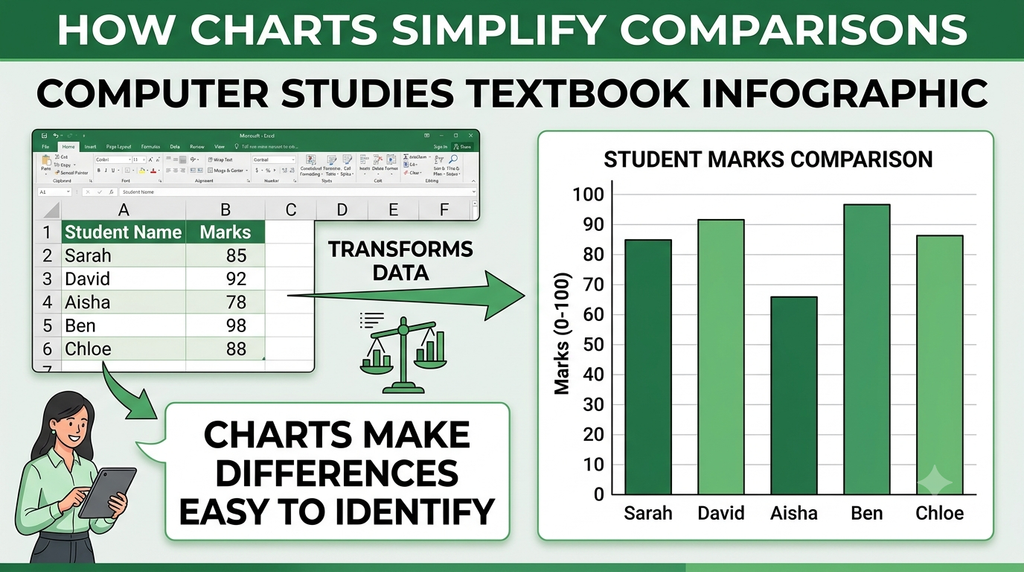
Charts help compare values across categories. For example, a bar chart can compare the sales of different products or the marks obtained by students.
3. Identify Trends and Patterns
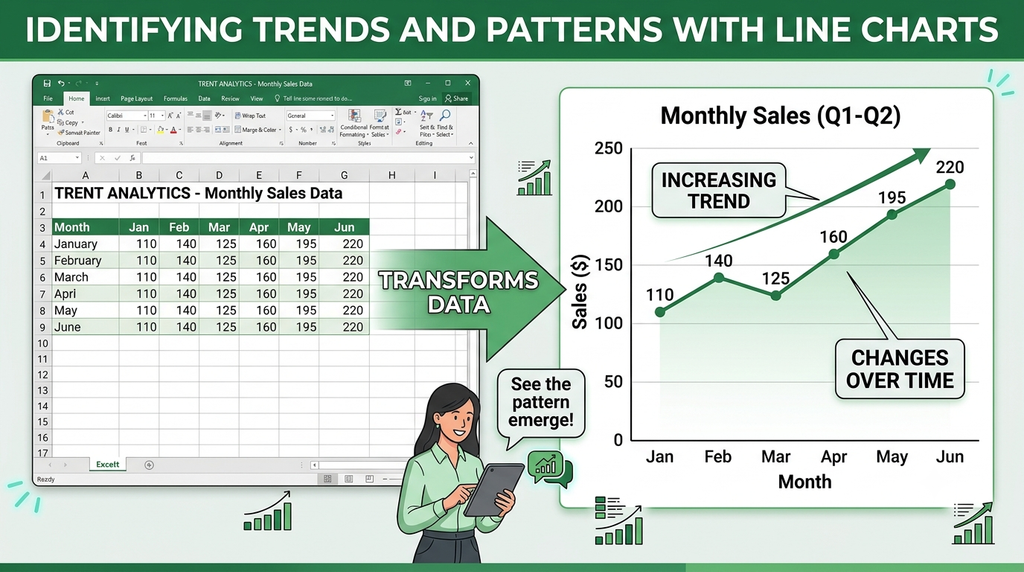
Charts make it easier to identify increases, decreases, fluctuations, and recurring patterns. Line charts are particularly useful for showing changes over time.
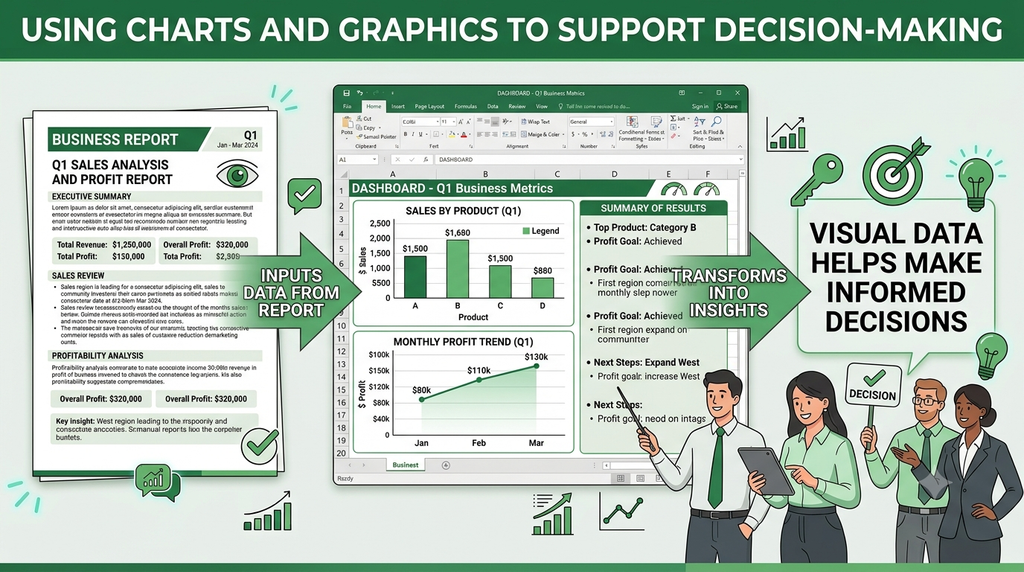
4. Improve Decision-Making
Visual information helps users interpret results and make informed decisions. Businesses can use charts to examine sales performance, expenses, profits, and other important figures.
5. Attract Attention
Colors, shapes, symbols, and illustrations can highlight important information and make reports and presentations more engaging.
6. Communicate Information Clearly
Charts and graphics help explain findings to an audience quickly. They are useful in reports, classroom presentations, business meetings, and educational materials.
7. Show Relationships and Proportions
Different chart types communicate different relationships. For example, pie charts show how individual values contribute to a whole, while scatter charts help reveal relationships between numerical variables.
Example
Suppose a school wants to present the marks obtained by five students. A table lists each student’s marks, but a bar chart allows readers to compare their performance quickly. Similarly, a line chart showing monthly sales can reveal whether sales are increasing or decreasing.
Conclusion
Charts and graphics are essential for presenting information effectively. They simplify complex data, support comparisons, reveal trends, attract attention, and improve communication. When the appropriate visual is selected and labelled clearly, information becomes easier to understand and use.
Main Uses of Charts and Graphics
- Simplifying complex data: Large amounts of information can be presented in an understandable visual form.
- Comparing information: Bar and column charts help compare values, such as sales across different months.
- Identifying trends: Line charts show changes over time, such as increases or decreases in monthly sales.
- Making presentations attractive: Graphics and charts improve the visual appearance of reports and presentations.
- Supporting decision-making: Visual summaries help users interpret results and make informed decisions.
- Showing proportions: Pie charts illustrate how individual values contribute to a total.

Conclusion
Charts and graphics are important because they make information easier to understand, compare, and communicate. They help present data clearly, reveal patterns, and support effective decision-making. Therefore, using appropriate charts and graphics makes Excel worksheets, reports, and presentations more informative and effective.