
Introduction
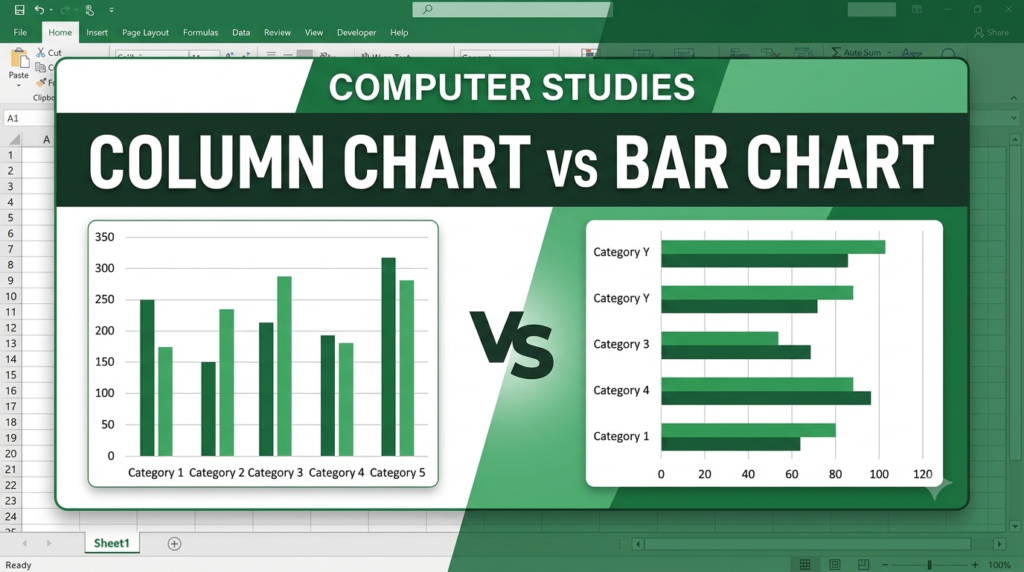
Column charts and bar charts are commonly used in Microsoft Excel to compare values across different categories. Both represent data using rectangular bars, but they differ mainly in the direction of the bars and the placement of category labels and numerical values. They help users compare information and identify the highest and lowest values easily.
Main Differences
| Column Chart | Bar Chart |
|---|---|
| 1. Displays bars vertically. | Displays bars horizontally. |
| 2. Categories are shown on the horizontal axis. | Categories are shown on the vertical axis. |
| 3. Values are shown on the vertical axis. | Values are shown on the horizontal axis. |
| 4. Useful for comparing values across categories and showing changes over time. | Useful for comparing categories, especially when category names are long. |
| 5. The height of each column represents its value. | The length of each bar represents its value. |
These are the standard distinctions described in Microsoft’s Excel chart guidance.
Examples

Column Chart
Compares monthly sales using vertical columns.

Bar Chart
Compares product sales using horizontal bars.
Conclusion
The main difference between a column chart and a bar chart is the orientation of their bars. Column charts use vertical bars, whereas bar charts use horizontal bars. Both are useful for comparing data, but horizontal bar charts are often preferable when category labels are long.